To customize the different dashboards offered by SWPanel, go to the My SWPanel's preferences using the icon above:

Then, click on the Dashboards tab:

In it we will find three sections:
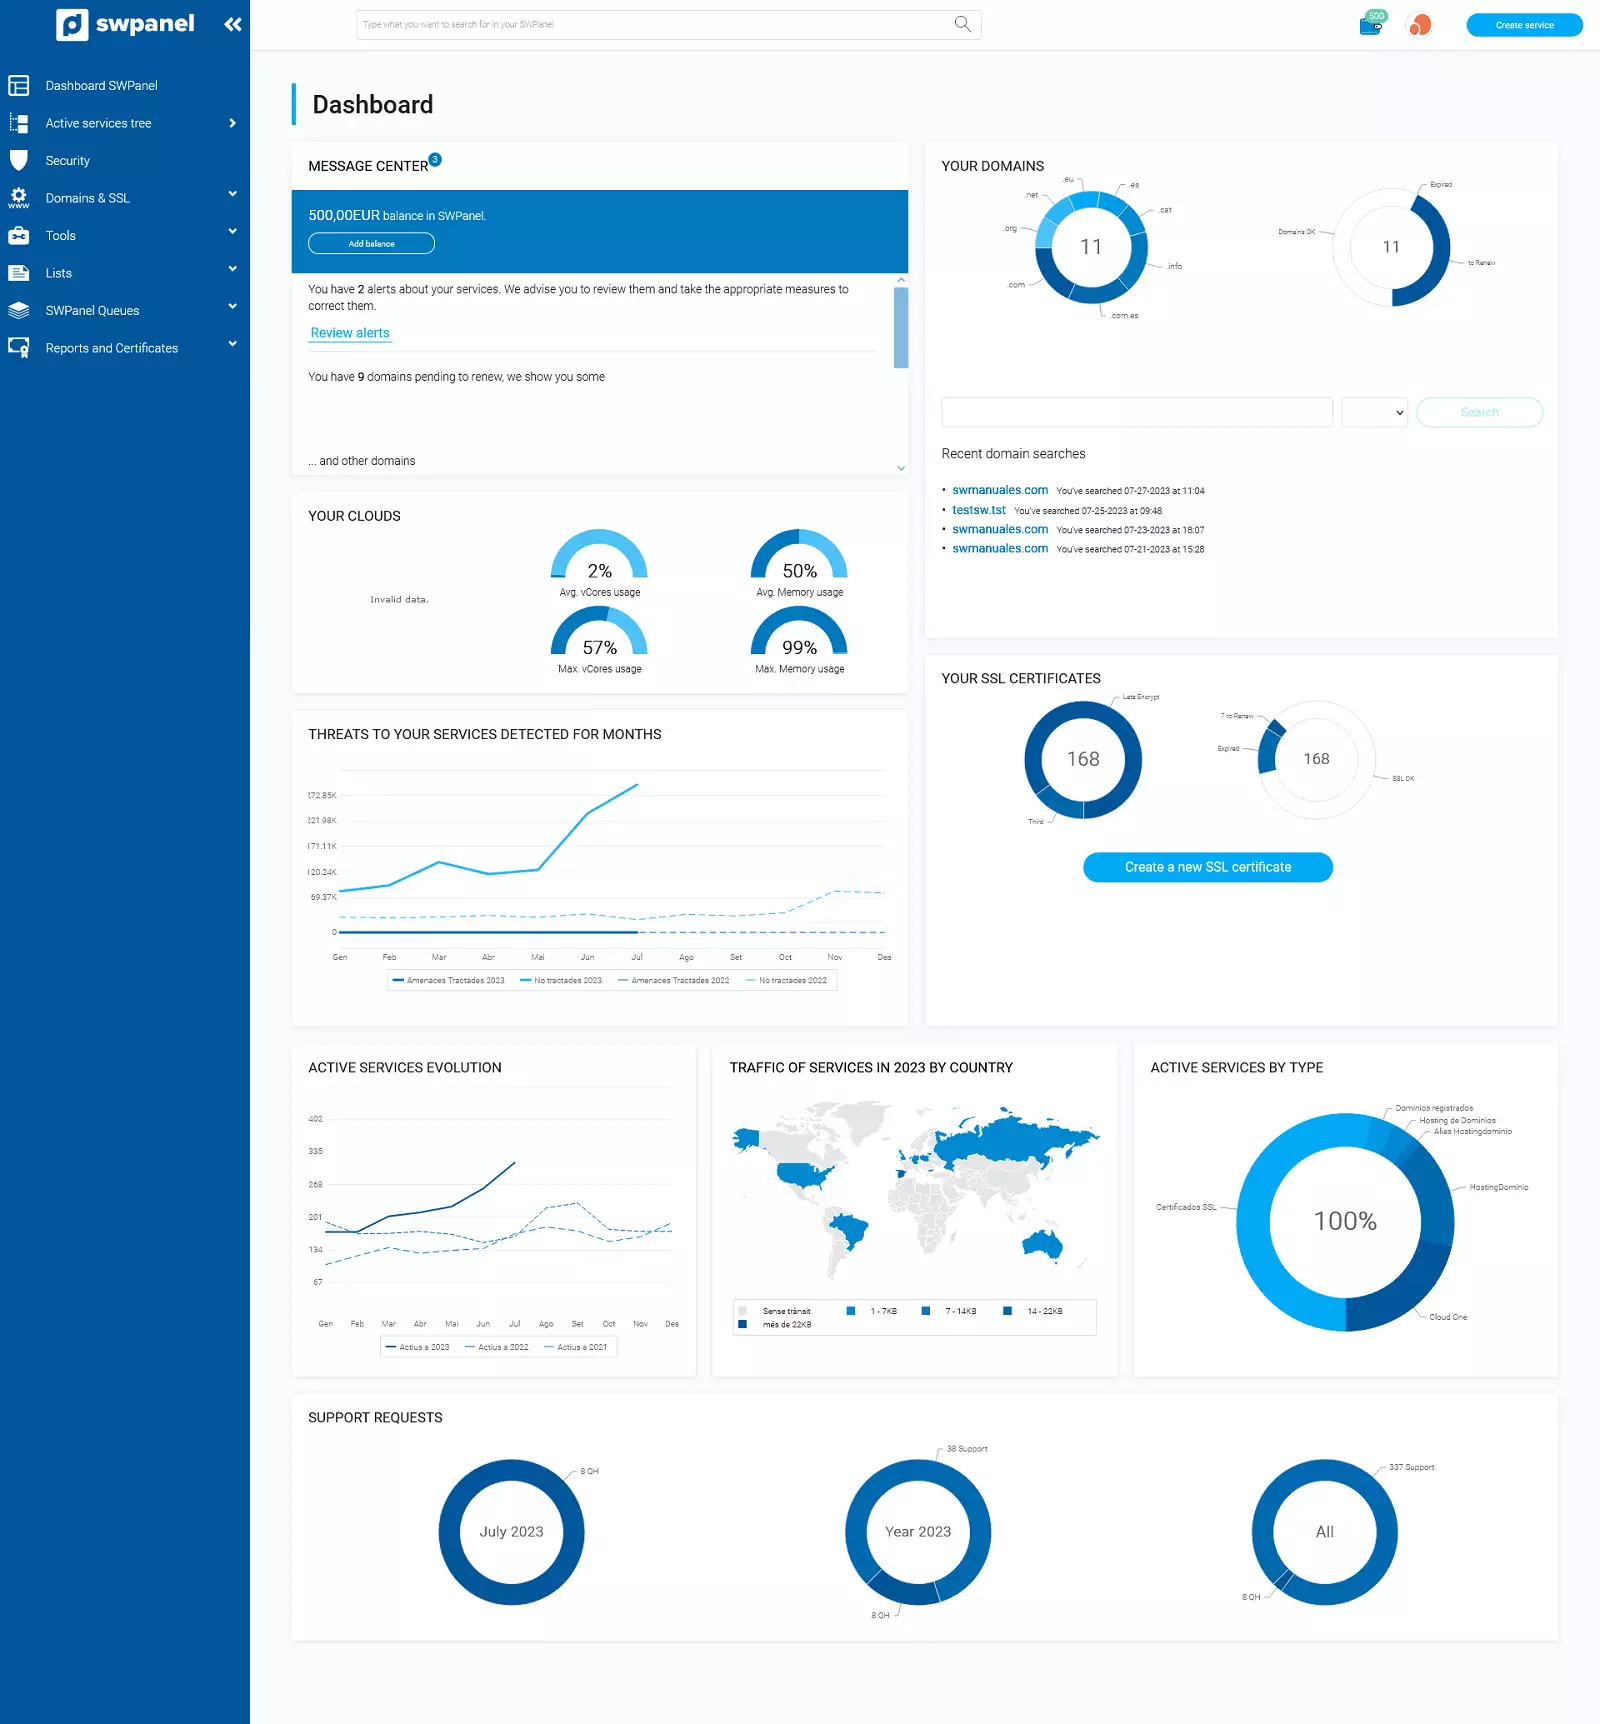
This first section refers to the main SWPanel Dashboard or the Dashboard that is displayed when you log in to your account.
This first block will allow you to show and hide the Quick Guides bar and customize the blocks that appear on the dashboard.
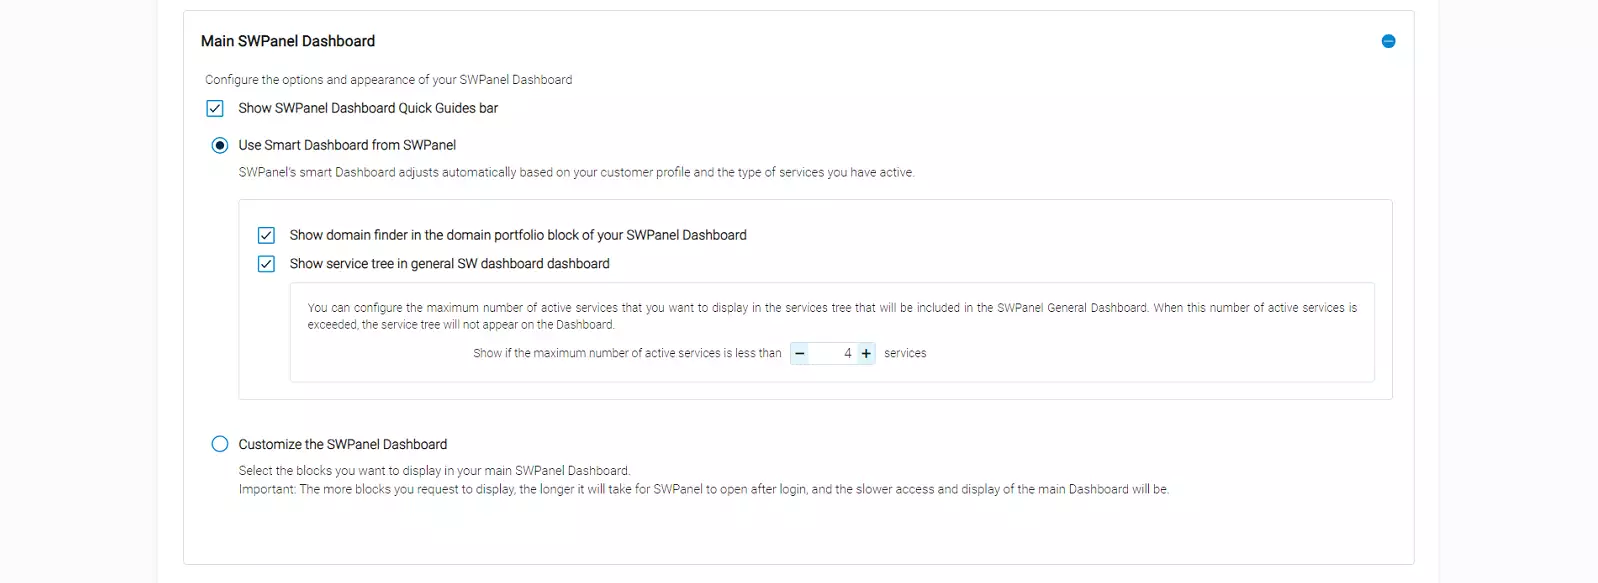
The Smart Dashboard will be adjusted according to the contracted services and your SWPanel account type:
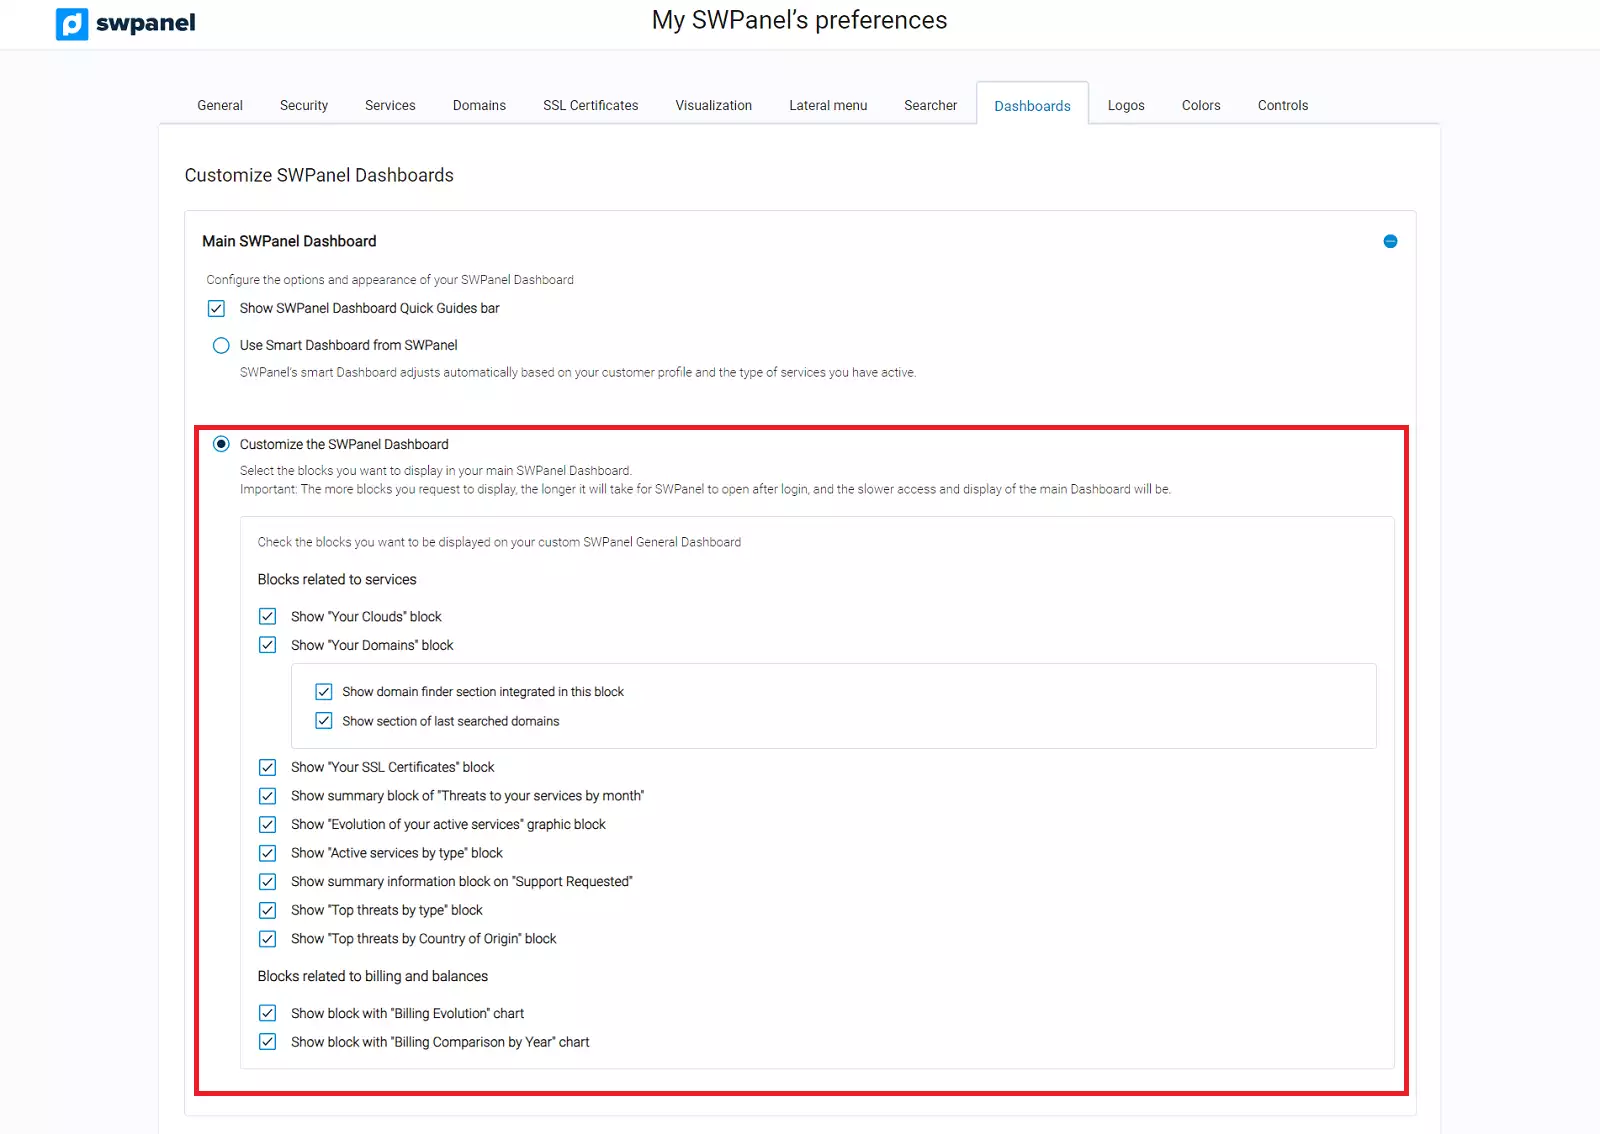
In case you check Customize SWPanel Dashboard you will be able to enable and disable the display of the sections you want to be shown on your dashboard.
This second section refers to both the Dashboard of a Cloud Server and the Dashboard of a Hosting Service.
This Command and Control Bar refers to the top icon bar that appears on both a Cloud Dashboard and a Hosting Service Dashboard:

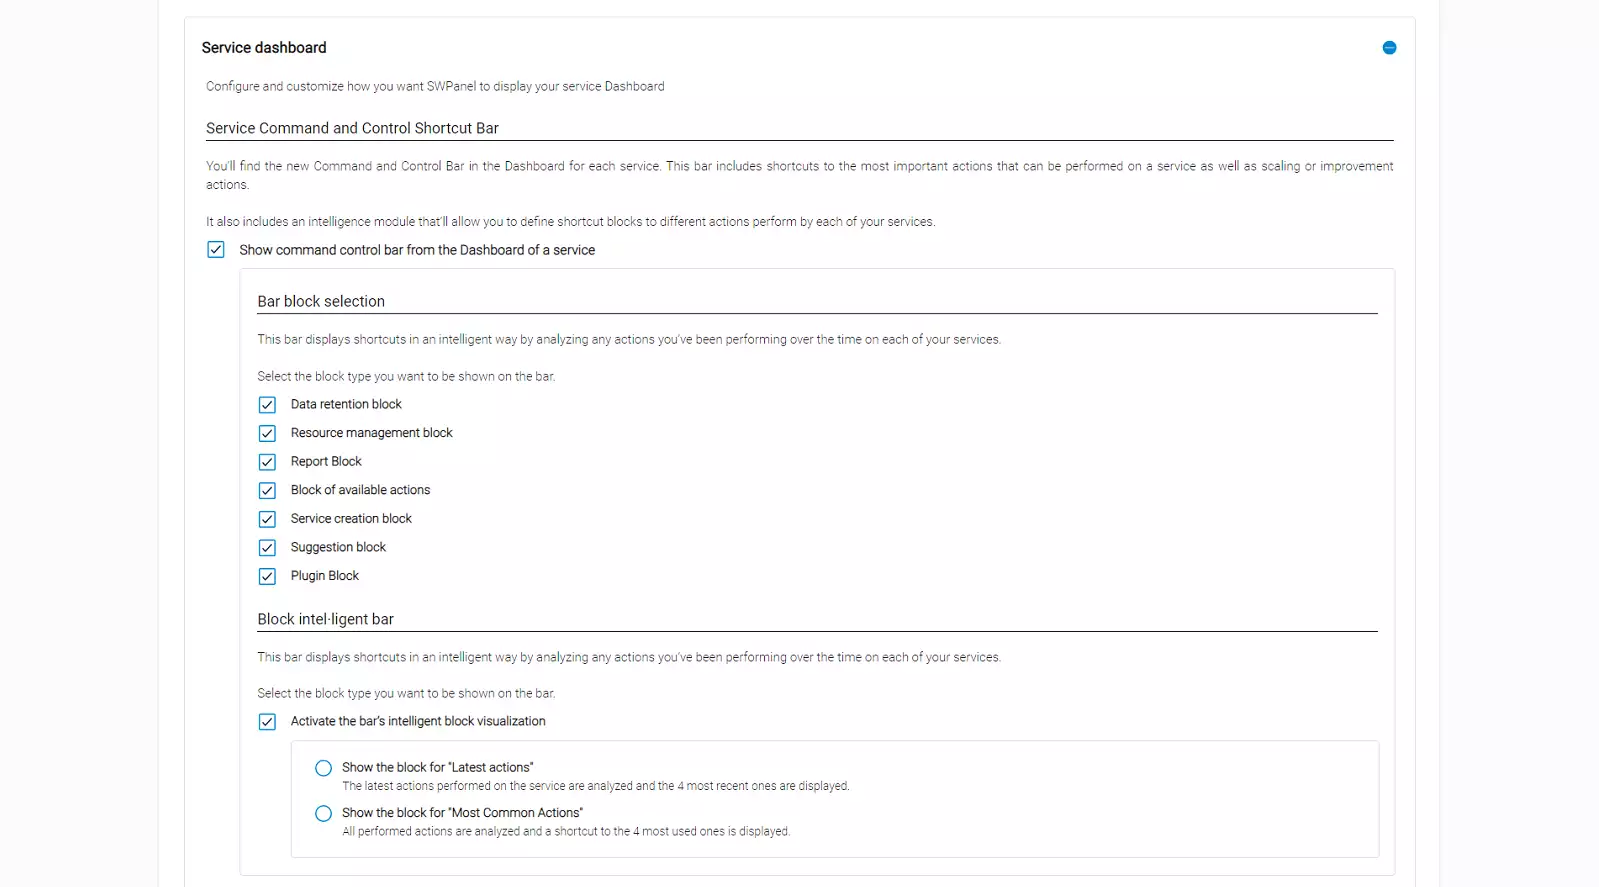
info The icons that appear in the Command and Control Bar in a Cloud Dashboard are specific to be able to manage a service of this type and different from the icons that appear in the Command and Control Bar of the Hosting Dashboard.
This block refers to the information tables of the Hosting services main Dashboards.
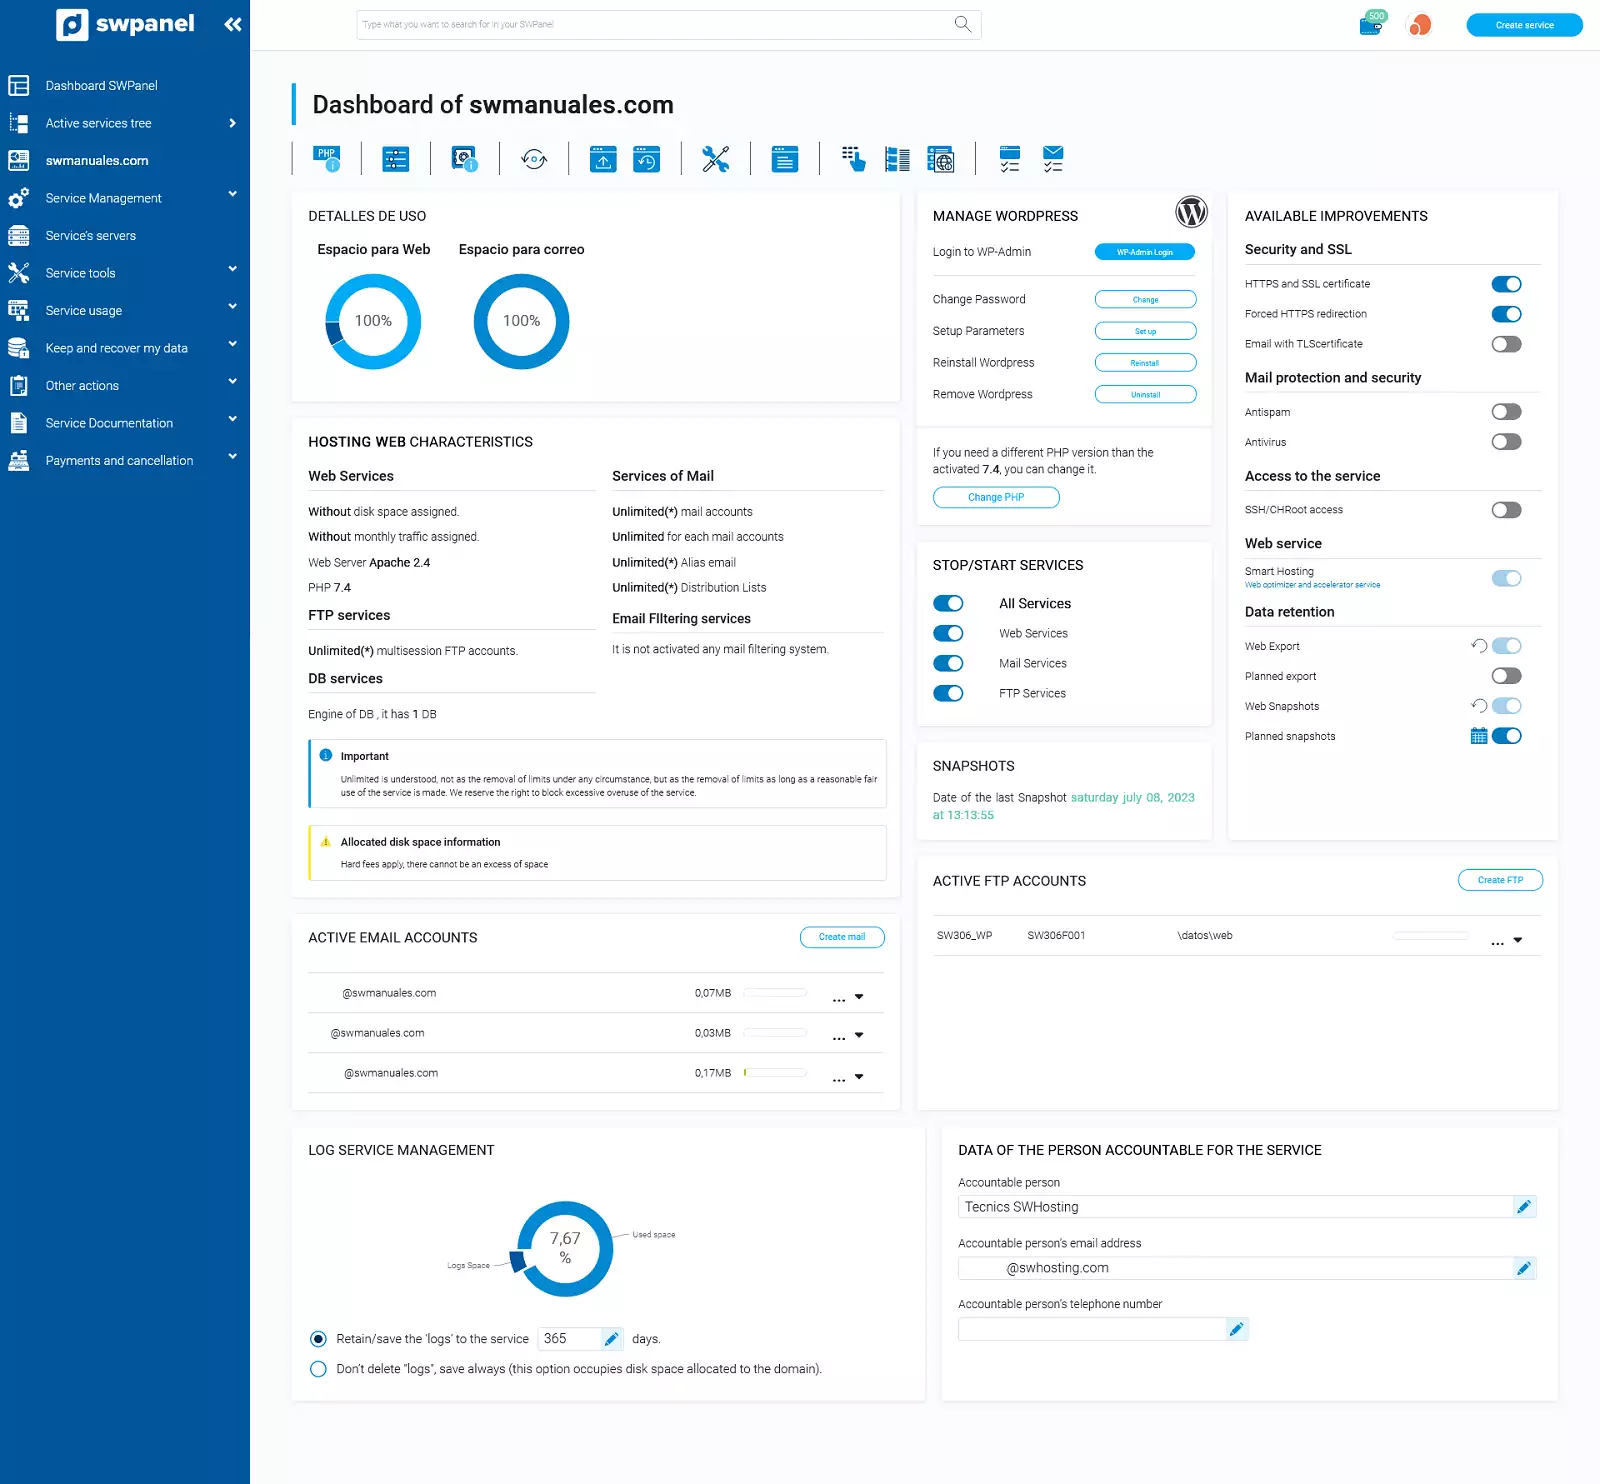
You will be able to check and uncheck the different options to create a customized Dashboard that fits the information you want to have access to.
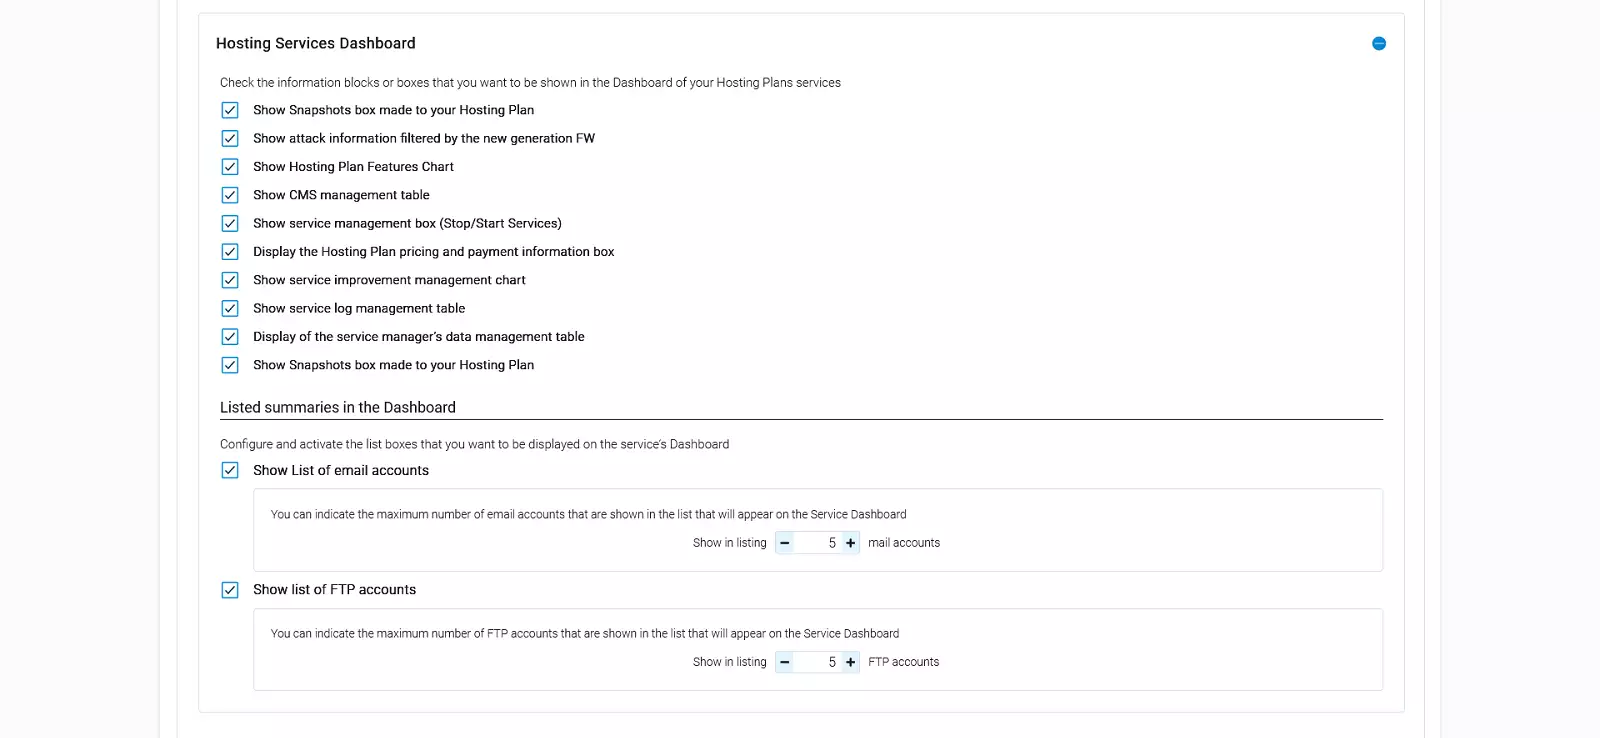
info The content of a Dashboard of a Shared Hosting has specific tools and information to be able to manage it and is different from the information and tools that appear in a Dashboard of a Cloud Hosting.
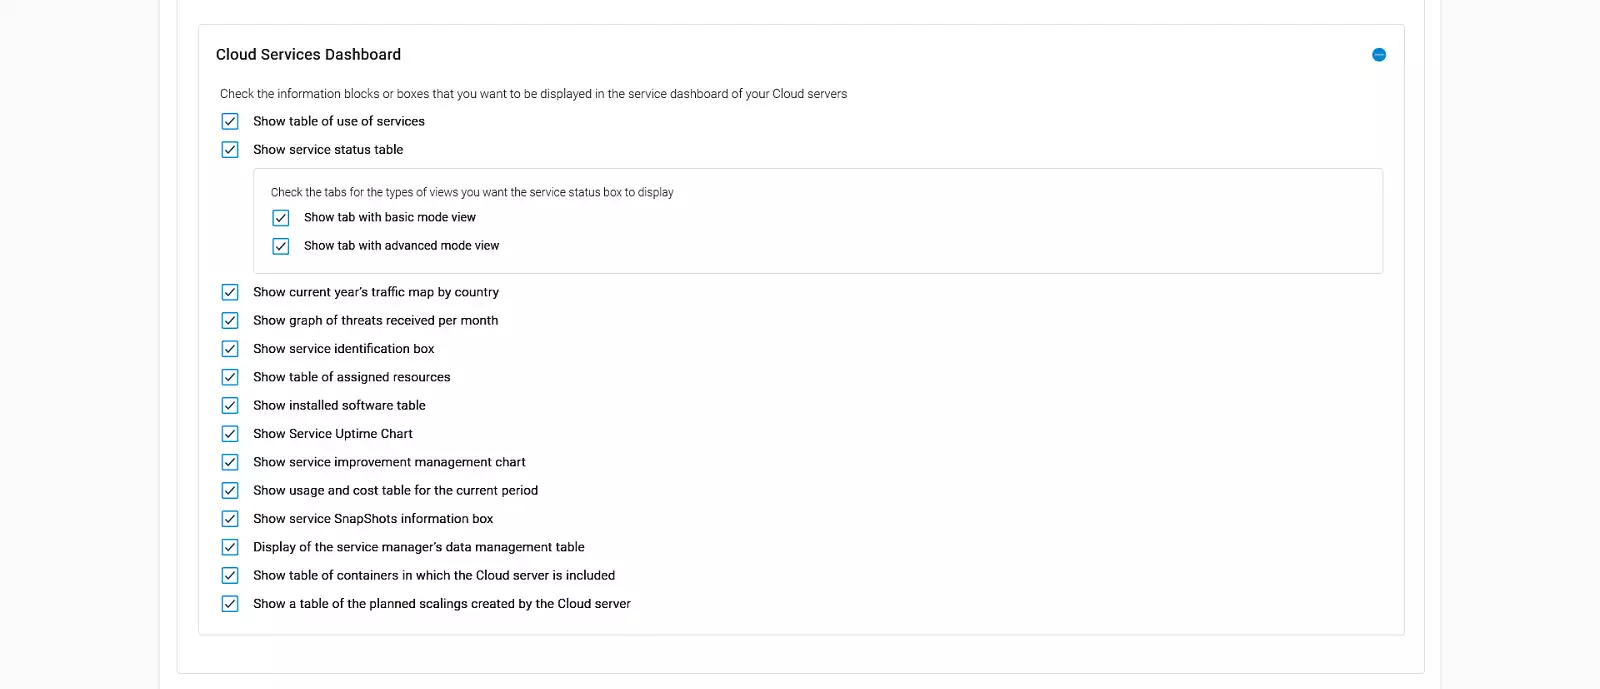
This last block refers to the information boxes of the main Dashboard of a Cloud.
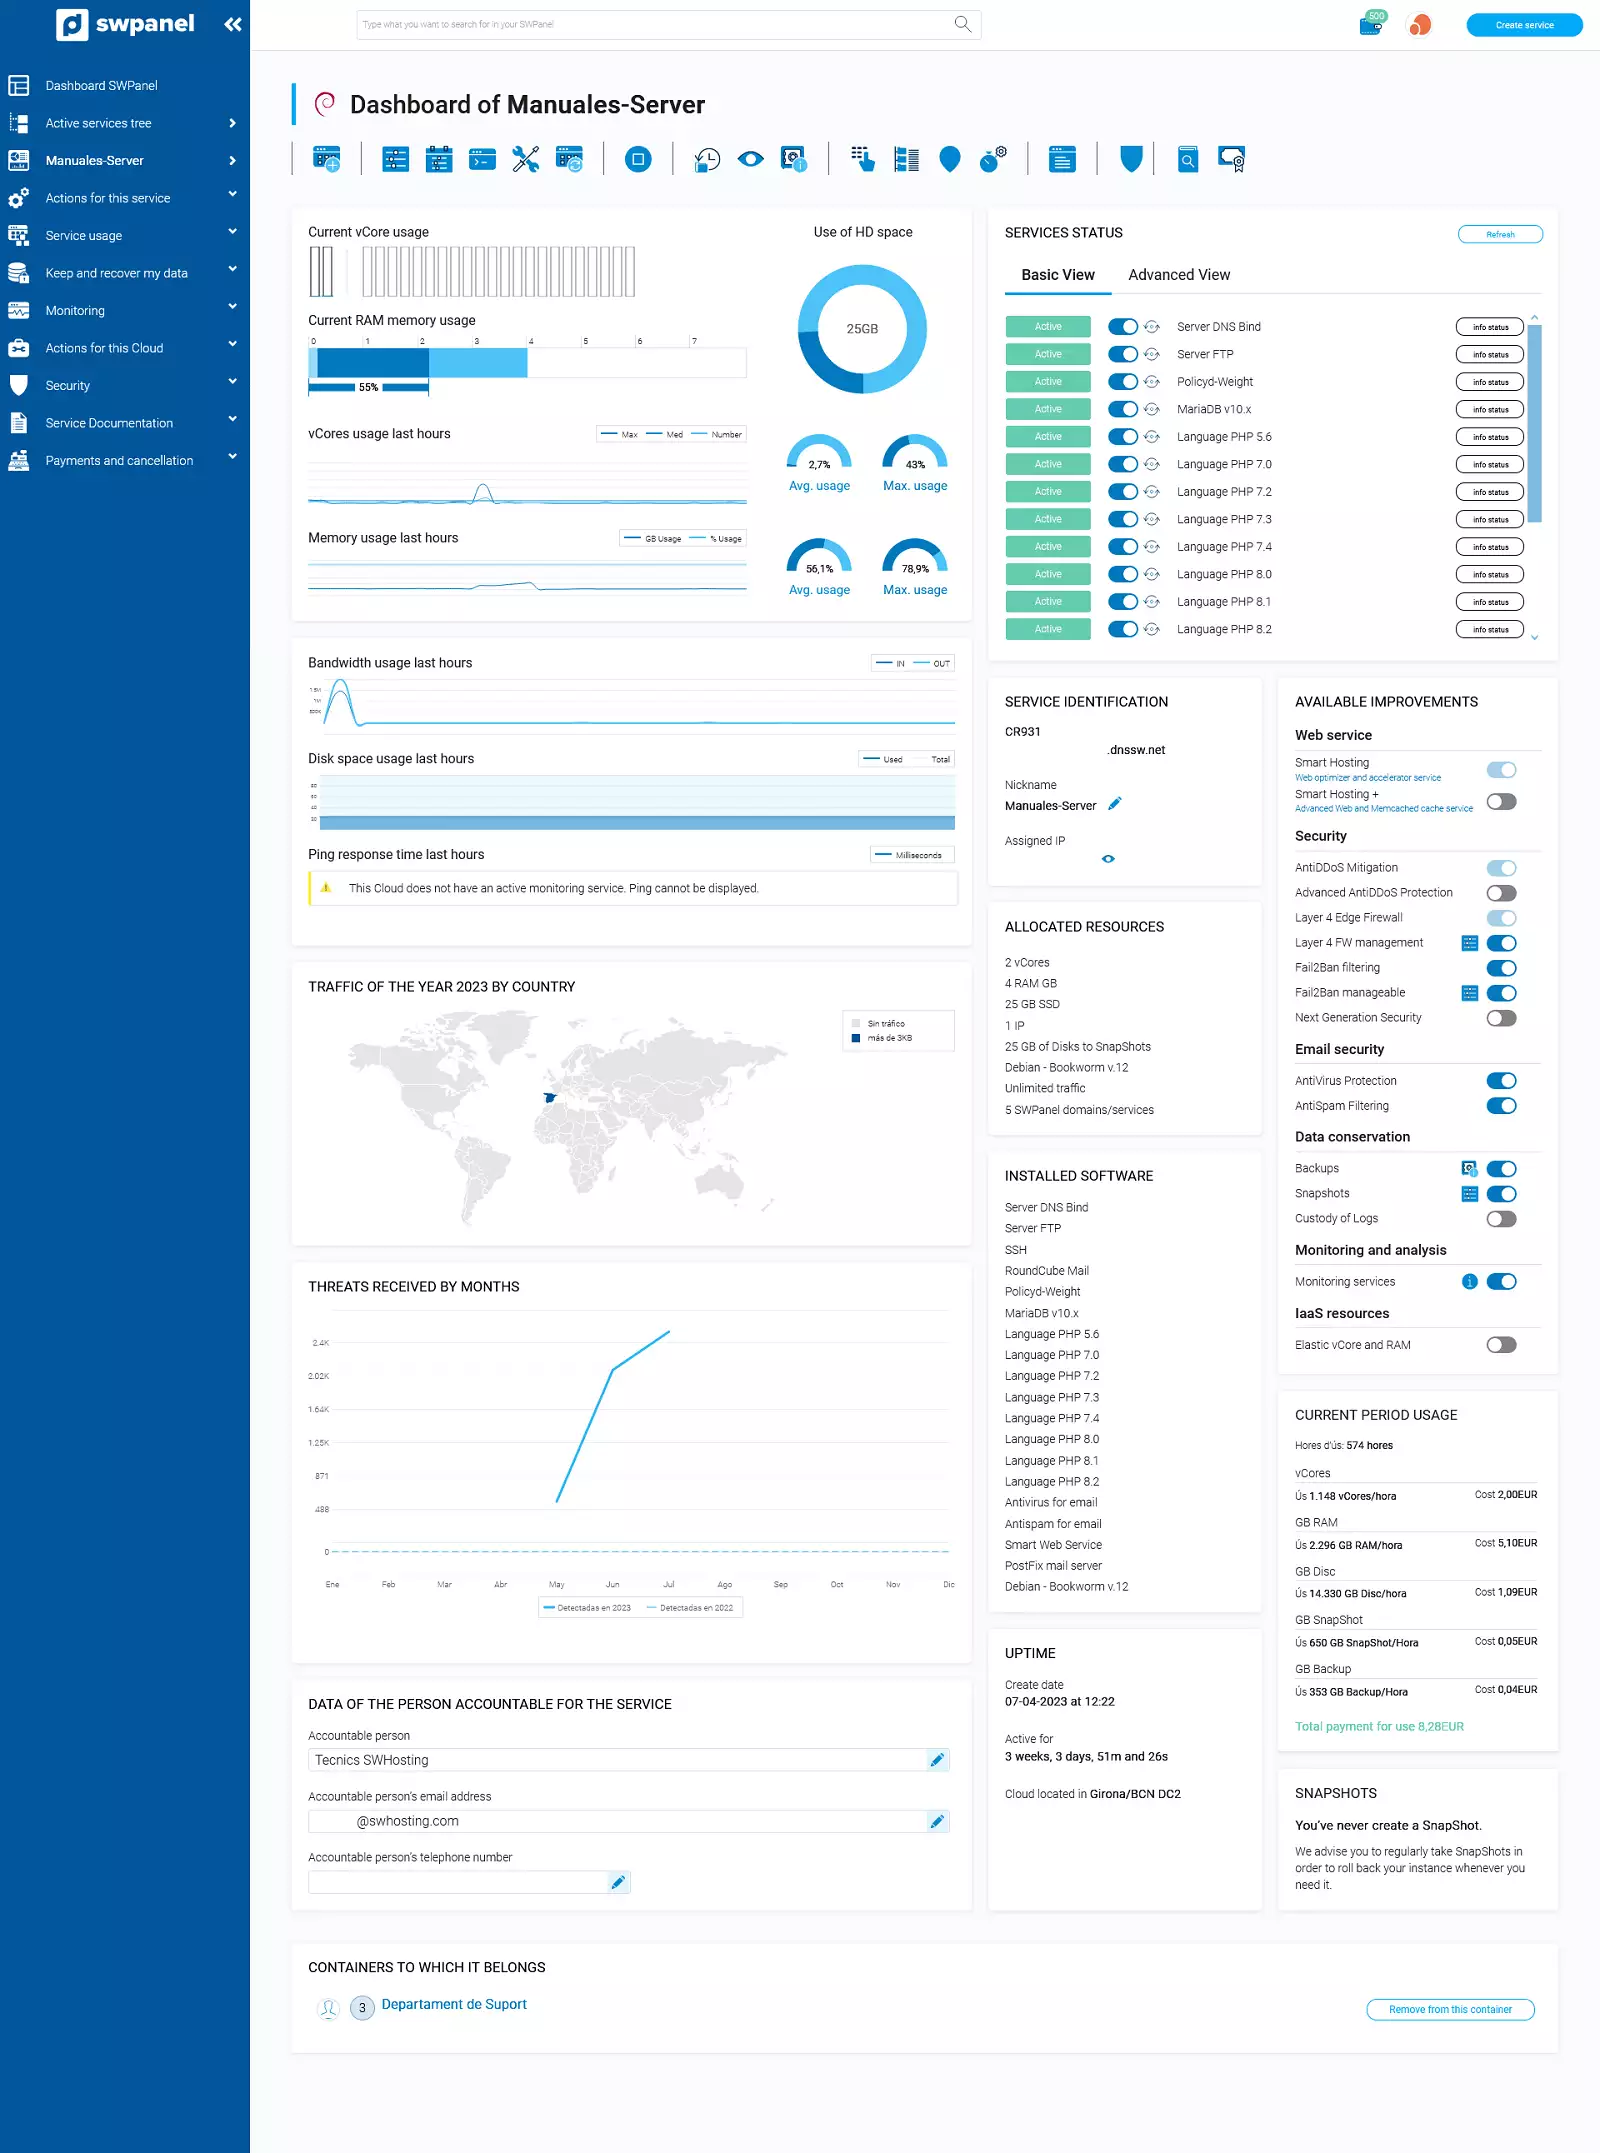
Check and uncheck the different boxes to customize the appearance of the Dashboards of a Cloud of your customer account and adjust them to your needs:
info The content of a Cloud Dashboard varies according to the features and software with which it is deployed.
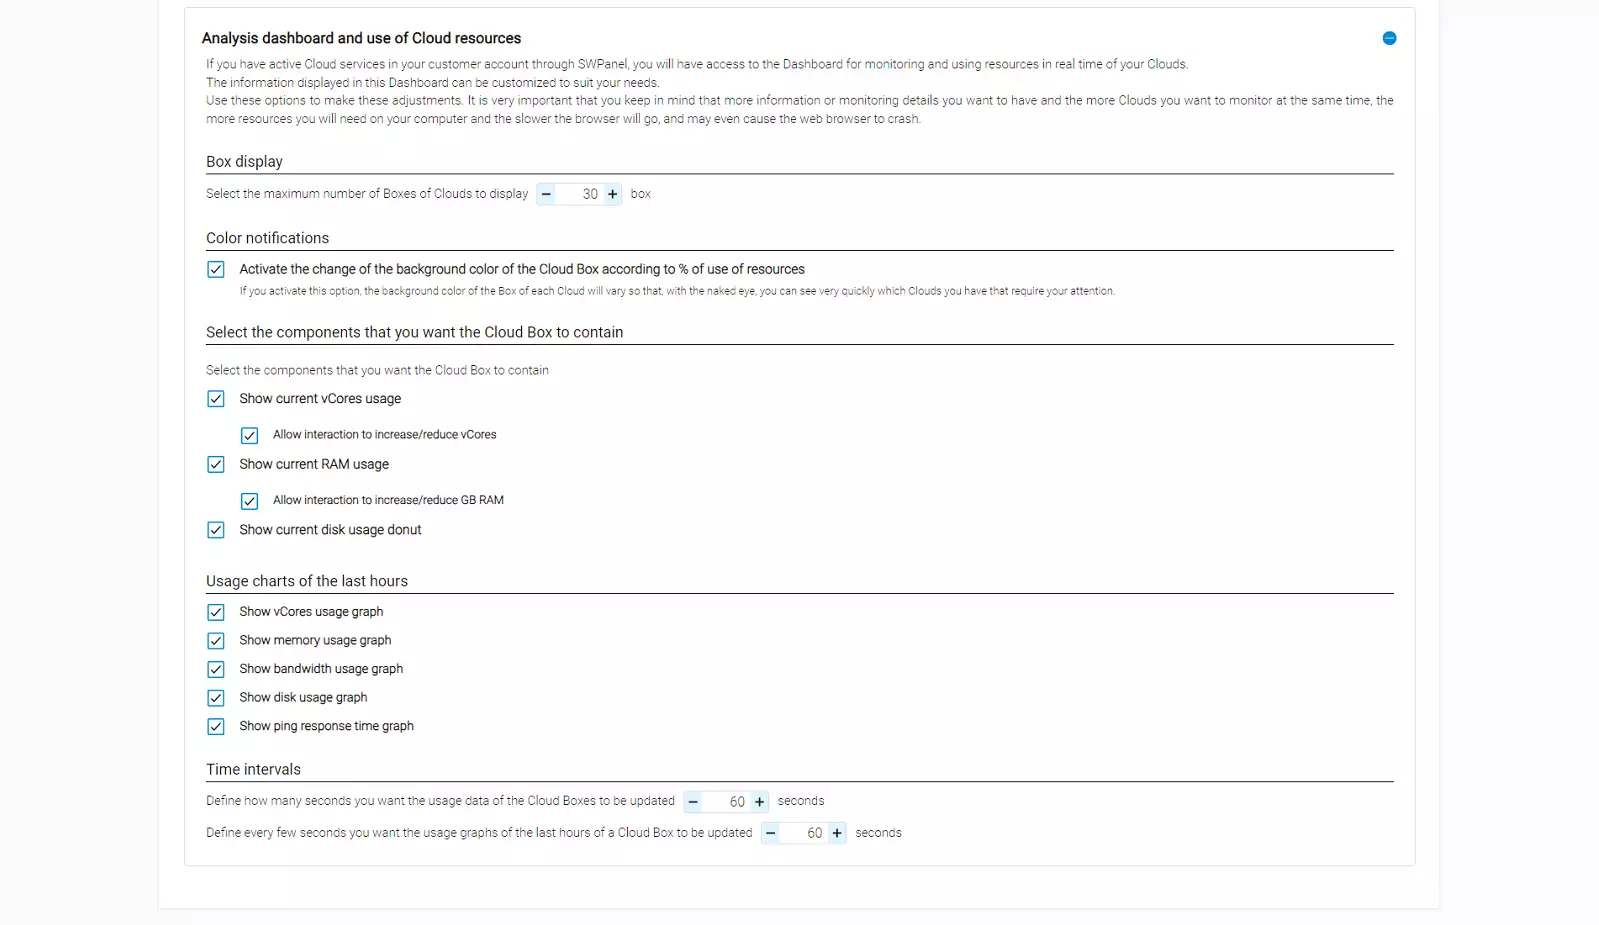
If you have Cloud servers in your Customer account you will be able to access the Cloud resources analysis and usage dashboard:
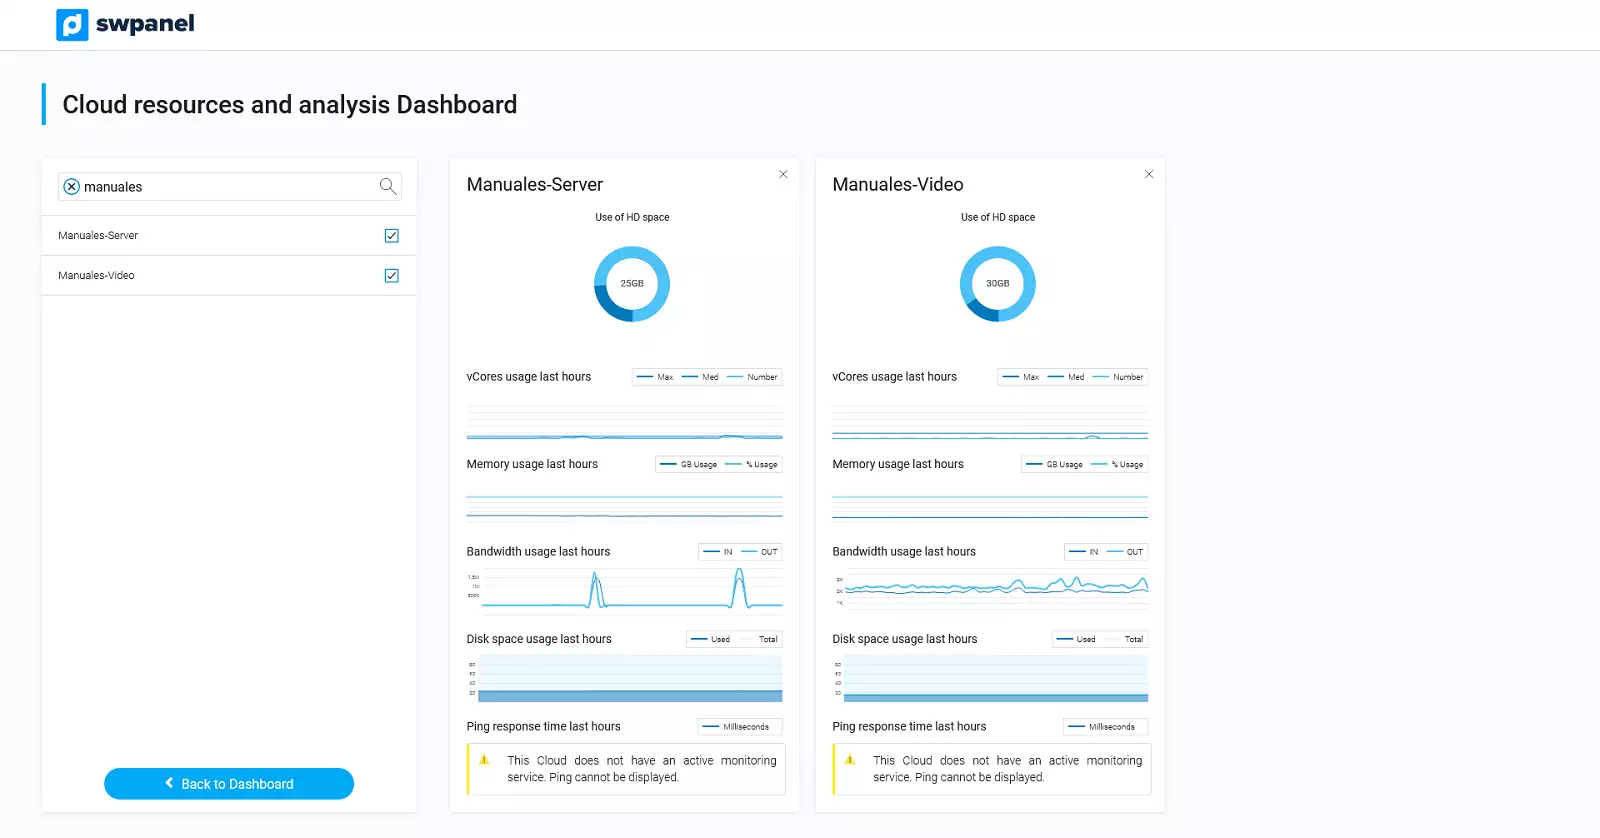
In this last section, you will be able to customize this Dashboard to suit your needs:
