To review the event log of your Cloud, you can follow the steps below:
1- Log in to SWPanel and go to the corresponding Cloud Dashboard using the top browser.
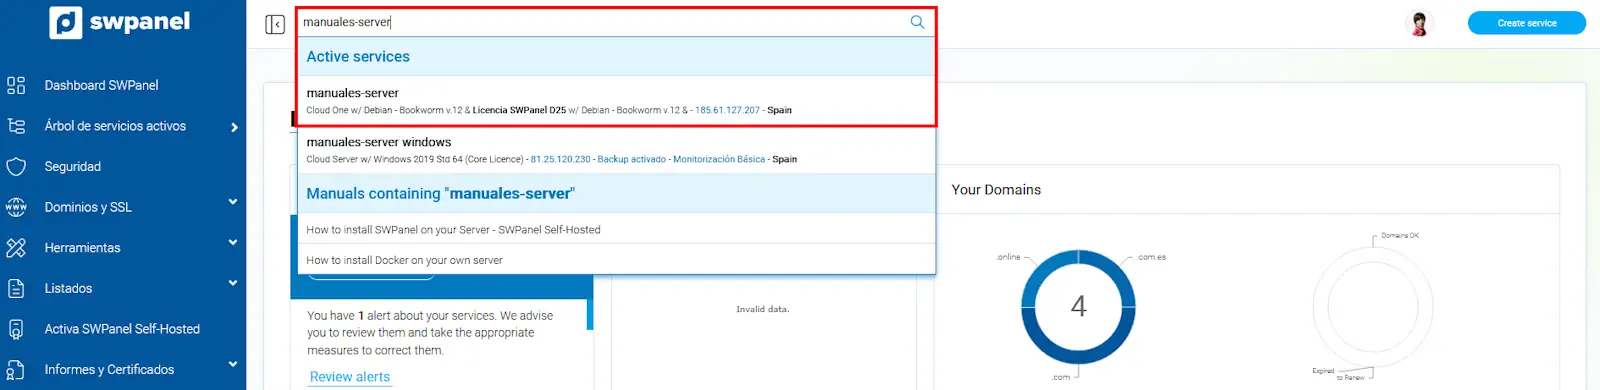
info_capture The screenshot is for guidance only. It was taken on version 2025.02.0002 dated 17/03/2025. It may differ from what the current version of SWPanel displays.
2- Once you are in your Cloud Dashboard, go to the LOG Manager by clicking on the LOGs icon.
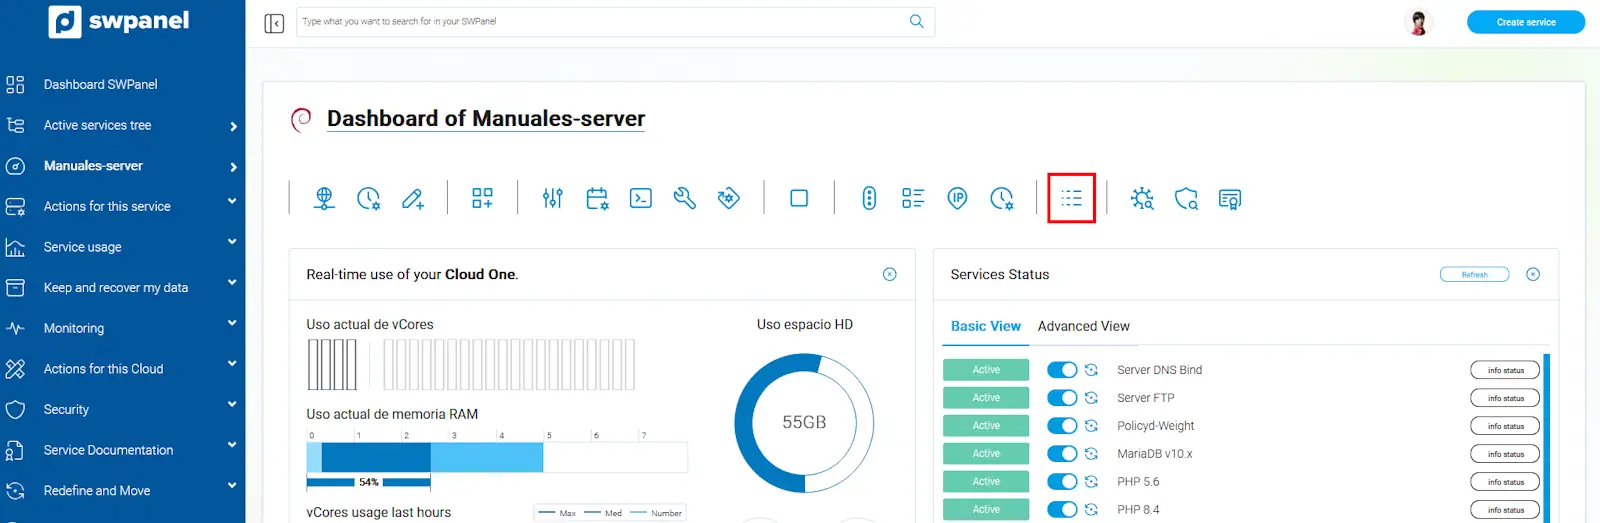
info_capture The screenshot is for guidance only. It was taken on version 2025.02.0002 dated 17/03/2025. It may differ from what the current version of SWPanel displays.
Here, you will be able to visualize the LOGs generated by the different services available on the server. The way to visualize them is the following:
3- Select the drop-down menu [...] and select "Download" or "View Log from SWPanel". If the log file is too large, the option "View Log from SWPanel" will not be available.
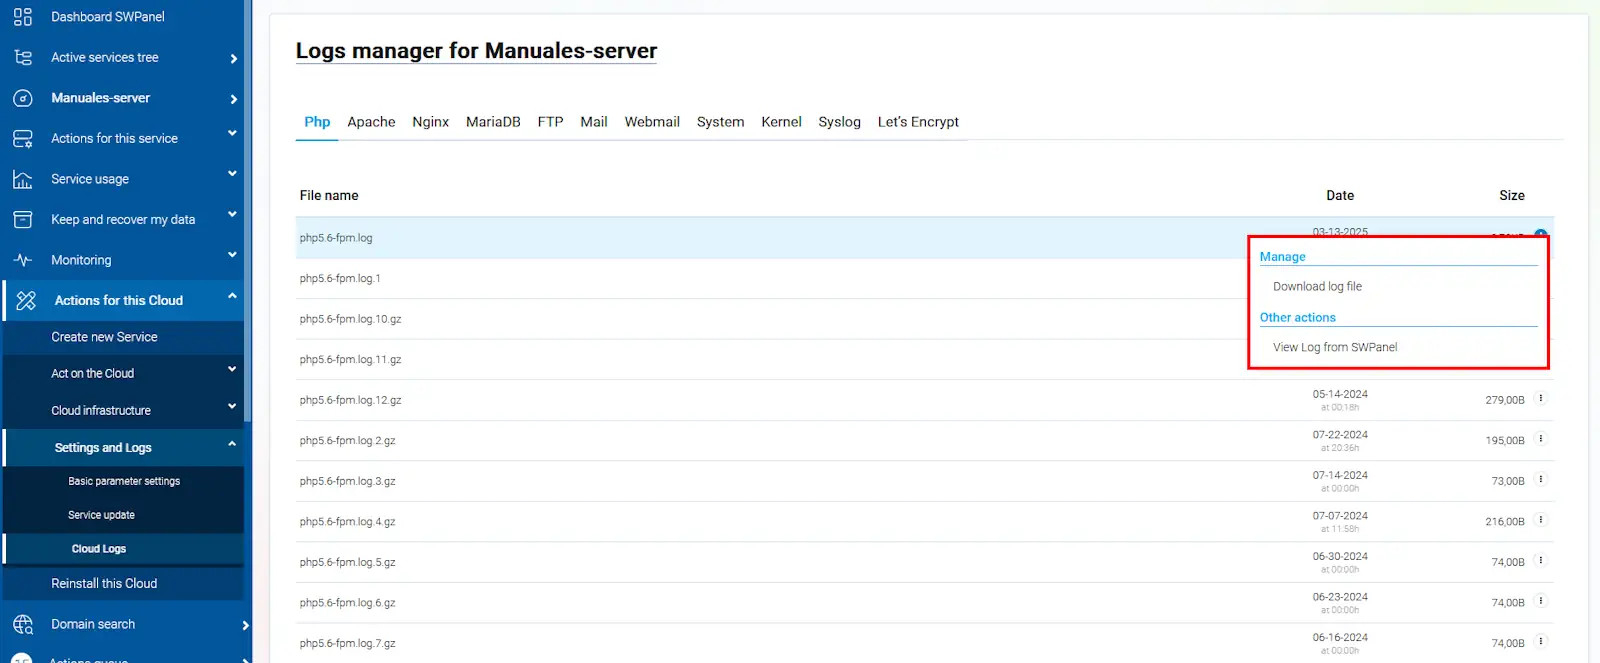
info_capture The screenshot is for guidance only. It was taken on version 2025.02.0002 dated 17/03/2025. It may differ from what the current version of SWPanel displays.
4- If you open it through the SWPanel, the aspect will be similar to this one.
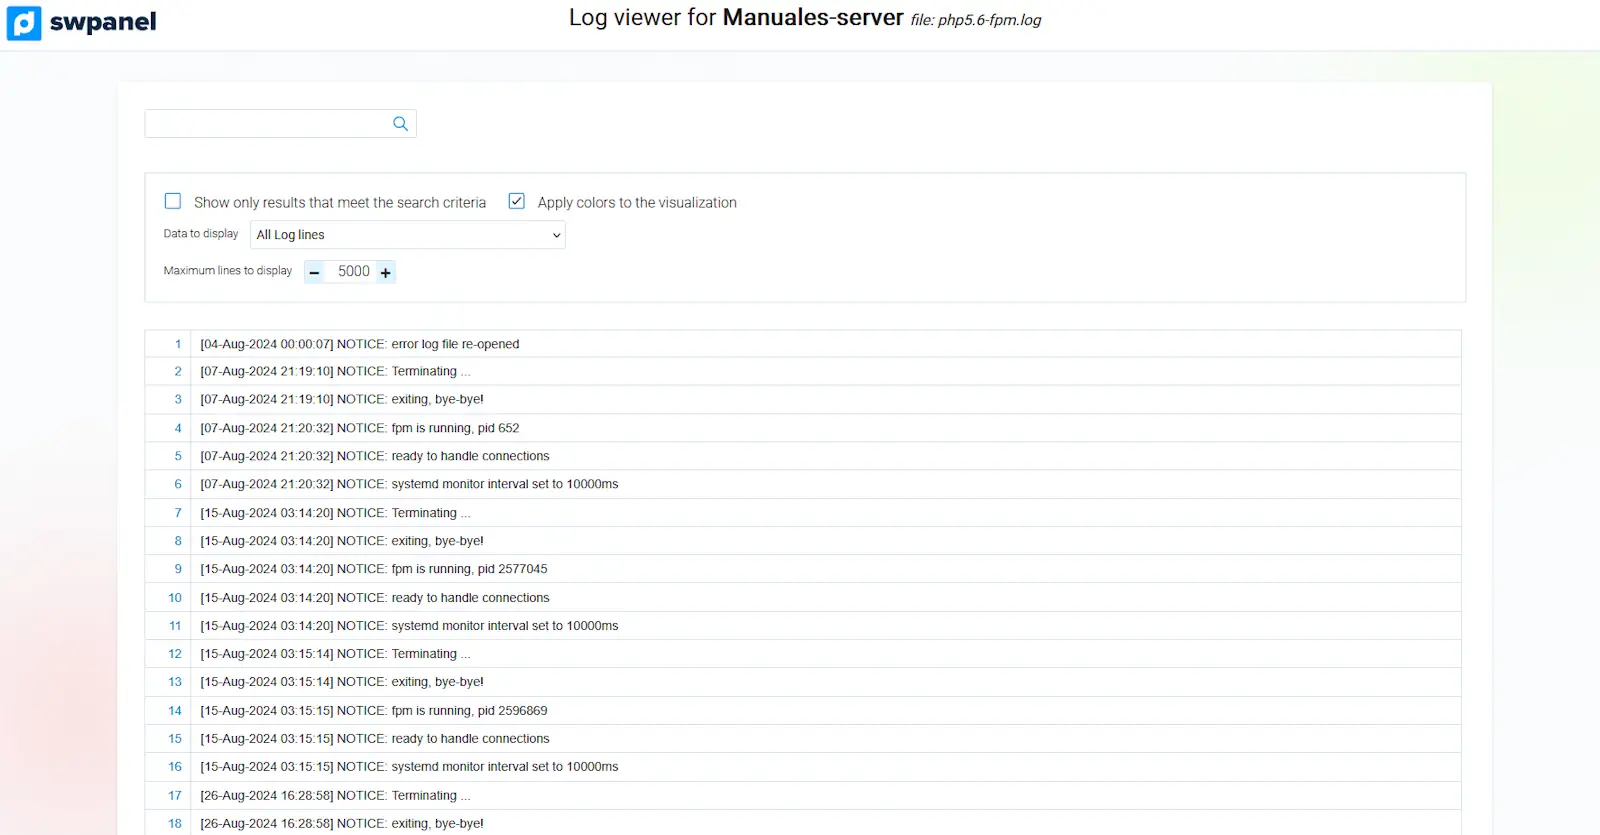
info_capture The screenshot is for guidance only. It was taken on version 2025.02.0002 dated 17/03/2025. It may differ from what the current version of SWPanel displays.
5- In the "Data to display" option, you can choose from the following options to filter and search only for the specific code.

info_capture The screenshot is for guidance only. It was taken on version 2025.02.0002 dated 17/03/2025. It may differ from what the current version of SWPanel displays.
All Log lines: --> Default option.
Only lines Result Ok - (Status 200) --> Filter only the lines containing the status 200, the request was successful
Only lines Result Redirect - (Status 300) --> Filter only lines containing status 300, equivalent to redirects.
Only lines Result Client Error - (Status 400) --> Filter only lines containing status 400, equivalent to client errors.
Only lines Result Server Error - (Status 500) --> Filter only the lines containing status 500, equivalent to server errors.
6- You can also choose the maximum number of lines to visualize, by default it is 5000, although you can modify it. You only have to write in the box the number of lines you want and press the "Enter" button.
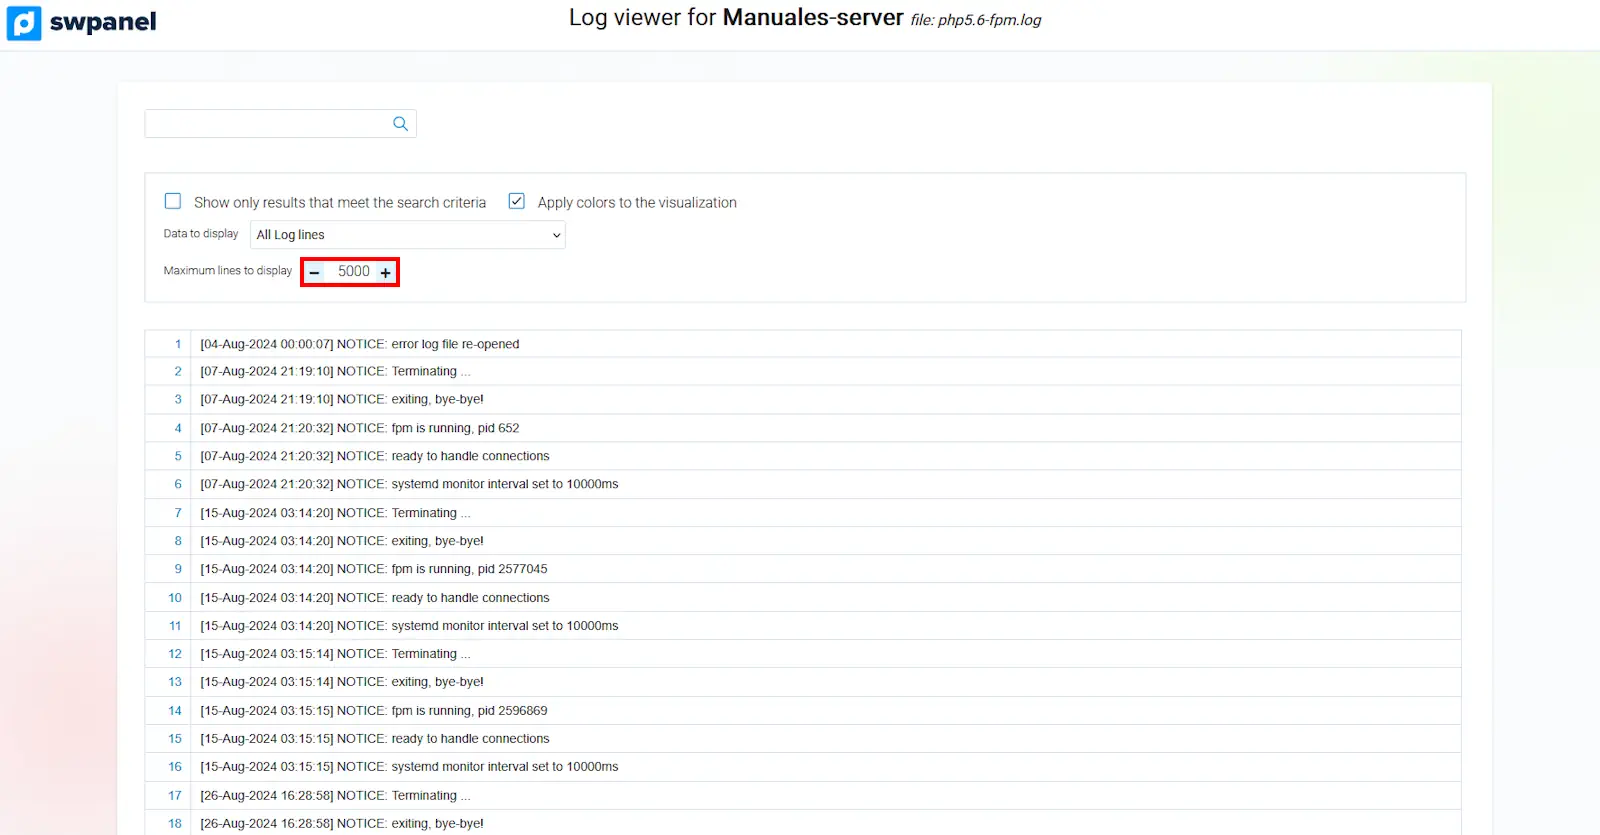
info_capture The screenshot is for guidance only. It was taken on version 2025.02.0002 dated 17/03/2025. It may differ from what the current version of SWPanel displays.
If you have any questions, please feel free to use our support wall: ? Talk to support with Quick Help